
20 Key Sales KPIs Every Team Should Track in October 2025
Sales performance shouldn’t feel unpredictable. Yet many teams still swing between record-breaking months and disappointing slumps because they track too many KPIs, or the wrong ones. The key isn’t more data, it’s better data: metrics that actually forecast growth and pinpoint where reps need support. By focusing on a few high-impact KPIs, sales leaders can build consistency, improve forecasting accuracy, and turn every data point into a coaching opportunity with platforms where KPI insights instantly trigger personalized, in-the-moment training.
TLDR:
Track 3 core KPIs: monthly sales growth, win rate, and average deal size
Pipeline coverage ratio predicts revenue better than current performance metrics
Customer acquisition cost should maintain 3:1 lifetime value ratio with <7% annual churn
Activity metrics like weekly prospect conversations separate top performers from average reps
KPI data is transformed into instant, personalized training with 95% adoption in just six minutes
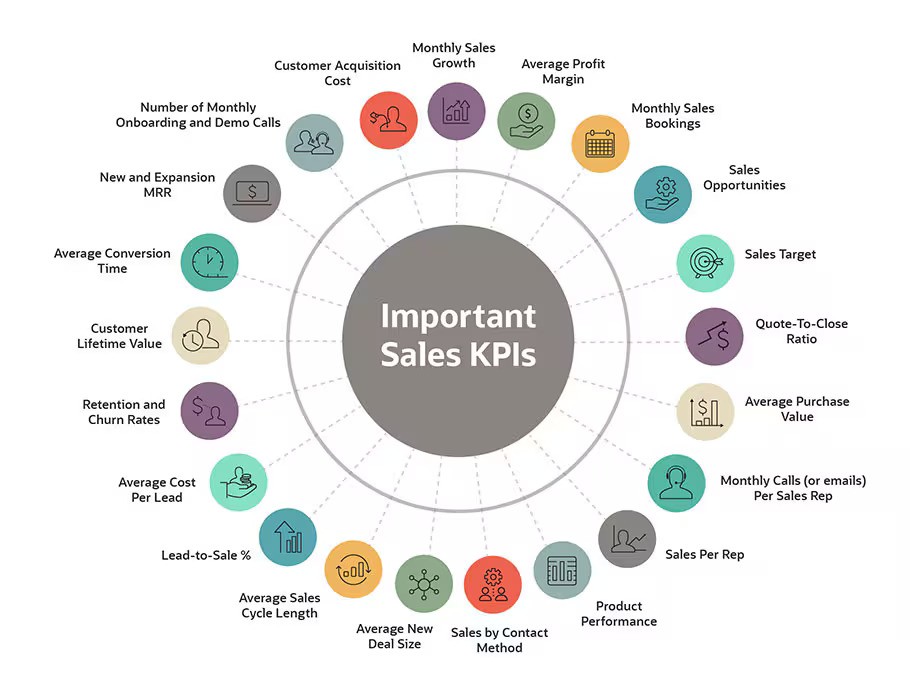
Key Sales Performance KPIs
Every sales team needs a foundation of core metrics to measure success and drive growth. These key KPIs form the backbone of sales performance tracking and provide the clearest picture of your team's health.
Monthly Sales Growth serves as your primary revenue indicator. Track month-over-month percentage increases to identify trends and seasonal patterns.
Win Rate measures your team's closing effectiveness by dividing won deals by total opportunities. Companies using data-driven sales strategies experience 5-6% higher productivity than competitors.
Average Deal Size reveals the value of each closed opportunity. Calculate this by dividing total revenue by the number of deals closed. This metric helps forecast revenue and identify upselling opportunities.
These three metrics interconnect to create a complete performance picture: higher win rates with larger deal sizes naturally boost monthly growth.
Lead Generation and Pipeline KPIs
Your pipeline metrics predict tomorrow's revenue better than any crystal ball. These forward-looking indicators help sales leaders spot problems before they impact quarterly results.
Lead Conversion Rate tracks how many prospects become paying customers. Only 2-5% of B2B leads typically convert into paying customers, making this metric important for resource allocation. Calculate it by dividing converted customers by total leads generated, then multiply by 100 for your percentage.
Pipeline Coverage Ratio measures whether you have enough opportunities to hit targets. The formula is simple: total pipeline value divided by quota.
Pipeline Velocity reveals how quickly deals move through your sales process. Multiply number of opportunities by average deal size and win rate, then divide by average sales cycle length.
New Qualified Leads measures your team's ability to generate future opportunities. Track both quantity and quality scores to avoid the common trap of focusing on volume over value. Insufficient pipeline generation often explains why teams with solid win rates still miss quotas.
Lead Quality Score combines demographic, behavioral, and engagement data to predict conversion likelihood.
Customer Acquisition and Retention Metrics
Understanding the complete customer journey requires tracking both how much it costs to acquire customers and how much value they deliver over time. These metrics reveal the true health of your sales engine beyond initial closing rates.
Customer Acquisition Cost (CAC) measures your total investment in winning new business. Calculate it by dividing all sales and marketing expenses by the number of new customers acquired. 2025 benchmarks show successful companies maintain a 3:1 LTV:CAC ratio, though this varies widely by industry complexity.
Customer Lifetime Value (CLV) is how much a company expects to earn over the entire business relationship. Multiply average revenue per customer by average customer lifespan to get your baseline CLV calculation.
Customer Churn Rate tracks how many customers you lose over time. Annual churn rates below 7% are generally acceptable, with top performers targeting under 5%.
Email Response Rates measure outbound effectiveness. Track both initial response rates and multi-touch sequence performance.
Meeting Acceptance Rates indicate how well reps qualify prospects and create compelling meeting requests. Strong performers convert 25-30% of qualified conversations into scheduled meetings.
Demo-to-Close Conversion tracks how effectively reps move qualified prospects through your sales process. This metric bridges activity and results, showing which reps excel at turning interest into decisions.
The evolution from activity tracking to performance coaching represents the biggest shift in sales management since CRM adoption.
Sales Team Performance and Forecasting KPIs
Performance and forecasting metrics separate reactive sales teams from proactive ones. These indicators help managers predict performance issues weeks before they impact results and optimize resource allocation across territories and reps.
Sales Cycle Length measures the average time from first contact to closed deal. Track this by deal size and source to identify patterns. Shorter cycles often indicate better qualification, while lengthening cycles signal market changes or competitive pressure.
Quota Attainment Rate reveals team-wide performance health. Up to 70% of B2B sales reps missed their quota in 2024, making this metric important for early intervention. Calculate by dividing actual revenue by assigned quotas across your team.
Forecast Accuracy compares predicted revenue to actual results. Leading teams now improve their forecast accuracy by 35% through better data collection and AI-powered insights. Track accuracy at 30, 60, and 90-day intervals to identify systematic forecasting errors.
The difference between leading and lagging indicators determines whether you're managing performance or just measuring it after the fact.
Pipeline Progression Rates track how deals move between stages. Measure conversion rates from each stage to the next, identifying bottlenecks before they compound. This leading indicator predicts future quota attainment better than current-quarter metrics.
Territory Performance Variance compares results across regions and market segments. High variance often indicates training gaps or market-specific challenges requiring targeted intervention.
How Arist Changes Sales Training Through KPI-Driven Insights
Traditional sales training treats skill gaps like annual events instead of daily opportunities. Arist flips this approach by connecting real-time KPI data directly to personalized learning moments that tackle specific performance challenges as they come up.
Automated Performance Triggers create learning opportunities from KPI insights. When pipeline velocity drops or win rates decline, Arist's AI instantly identifies the underlying skill gaps and delivers targeted microlearning. This approach achieves 95% adoption within 6 minutes because training arrives precisely when reps need it most.
Real-Time Skill Gap Analysis changes KPI dashboards from reporting tools into learning catalysts. Instead of waiting for quarterly reviews, AI coaching integrations with tools like Gong and Outreach trigger immediate training when conversation analysis reveals positioning weaknesses or objection handling gaps.
Personalized Learning Pathways adapt based on individual KPI patterns. A rep struggling with demo-to-close conversion receives different content than someone with low activity metrics. Arist's industry-leading AI converts thousands of pages of sales documentation into personalized courses that tackle each rep's specific performance challenges.
Measurable Training Impact connects learning directly to KPI improvements. Teams using buyer-centric sales enablement strategies see immediate correlation between training completion and performance metrics. The 84% completion rate and 8/10 satisfaction score demonstrate that KPI-driven training creates engagement because it solves real problems.
FAQs
How many sales KPIs should your team track?
Most effective sales teams track between 4-10 KPIs, varying by role and responsibility. Focus on 3 core metrics (monthly sales growth, win rate, and average deal size) as your foundation, then add pipeline and activity indicators based on your specific challenges.
When should you update your sales KPI dashboard?
Update frequency depends on your role: executives need weekly revenue updates, sales managers require daily team performance data, and individual reps benefit from real-time activity tracking. Day-to-day teams should monitor conversion metrics hourly for immediate optimization opportunities.
How do you calculate customer lifetime value for sales planning?
Multiply your average revenue per customer by the average customer lifespan to get baseline CLV. Maintain at least a 3:1 CLV to CAC ratio, though this varies by industry complexity and business model.
What's the difference between leading and lagging sales indicators?
Leading indicators (like pipeline velocity and activity metrics) predict future performance and allow proactive management, while lagging indicators (like monthly revenue) measure past results. Successful teams use leading indicators to prevent problems before they impact quarterly results.
Final thoughts on sales performance KPIs
The right KPIs drive performance. When every metric becomes a learning signal, sales teams stop reacting to results and start improving them in real time. By linking KPI tracking with adaptive microlearning, organizations can close skill gaps the moment they appear, building consistency across every rep and region. Platforms like Arist make this possible, changing raw sales data into actionable training that turns performance insights into predictable growth.
Jasper Ng
Bring
real impact
to your people
We care about solving meaningful problems and being thought partners first and foremost. Arist is used and loved by the Fortune 500 — and we'd love to support your goals.
Curious to get a demo or free trial? We'd love to chat:

